How to Find the Errors That Matter in a Log of 63 Thousand Lines
Something went wrong overnight and the service log is 5.6 MB: 63,369 lines. Most of them are cache hits and request logs. Somewhere in there are the errors, each one repeated hundreds of times with a different order number or request ID, so even grep ERROR gives back 4,313 lines. Reading those by hand, or pasting them into a chat with a coding agent, is how an hour disappears.
The log in this example is the generated application log from our test fixtures: Java exceptions with stack traces, Python tracebacks, a Go panic, database errors, in the proportions a busy service produces them. The question is the one you’d ask of a real one. How many different things went wrong, and what are they?
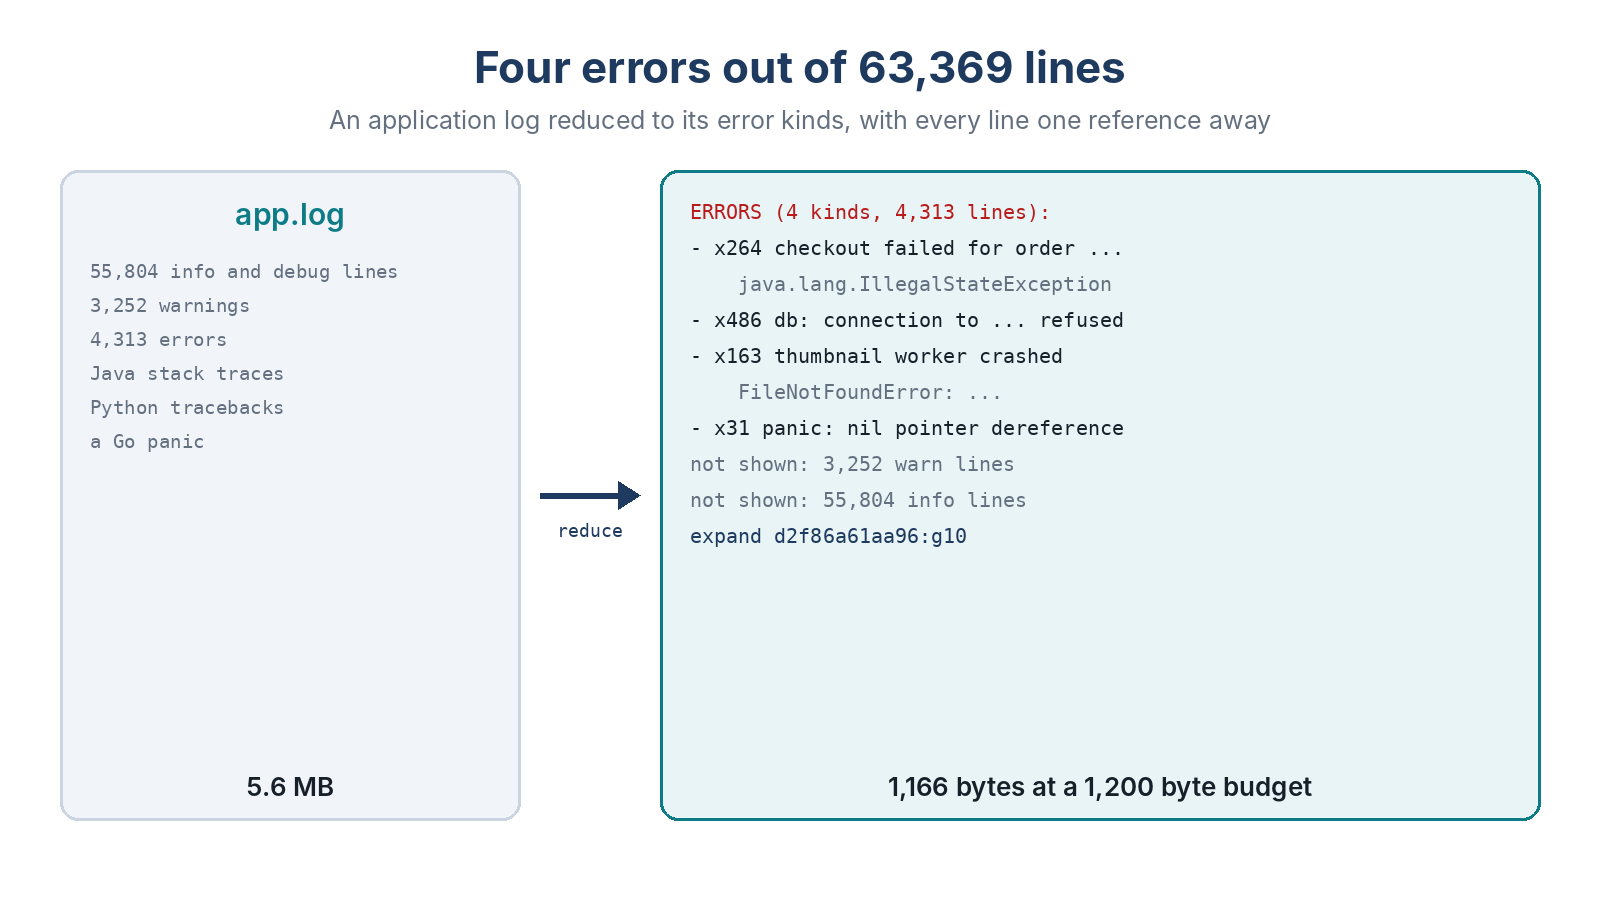
One Command
abbreviatory reduce -budget 1200 -preserve errors app.log
[abbreviatory] log, 63,369 lines (5.6 MB), ref d2f86a61aa96
lines: 4,313 error, 3,252 warn, 55,804 other; 14 distinct messages
ERRORS (4 kinds, 4,313 lines):
- x264 2026-10-18T08:00:07.073Z ERROR checkout failed for order 75504 [ref d2f86a61aa96:g9]
    java.lang.IllegalStateException: payment gateway did not answer
    ... (6 lines left out)
    	... 4 more
- x486 2026-10-18T08:00:10.517Z ERROR db: connection to 10.0.4.5:5432 refused (request_id=b05ab8a9) [ref d2f86a61aa96:g10]
- x163 2026-10-18T08:00:15.331Z ERROR thumbnail worker crashed [ref d2f86a61aa96:g11]
    Traceback (most recent call last):
    ... (4 lines left out)
    FileNotFoundError: [Errno 2] No such file or directory: '/data/uploads/3334.jpg'
- x31 panic: runtime error: invalid memory address or nil pointer dereference [ref d2f86a61aa96:g13]
Four kinds of error. The 4,313 error lines were 264 failed checkouts, 486 refused database connections, 163 thumbnail crashes and 31 panics. The order numbers, request IDs and IP addresses don’t split a group, because lines that differ only in numbers and hex IDs count as the same message. A stack trace stays with its line, so the same error with a different trace would be its own group.
-preserve errors keeps errors only and counts the warnings and info lines in two “not shown” lines at the end. At the default budget of 4 kB, with warnings kept too, the same log gives a 3,075-byte report with the three warning kinds and the busiest info lines as well.
Back to the Original Lines
Every group has a reference. The database errors are g10:
abbreviatory expand d2f86a61aa96:g10
That prints all 486 original lines, byte for byte, in the order they were in the log, so you can see which hosts refused and when it started. Pipe it to head, grep or your agent. d2f86a61aa96:warn brings back all the warnings, and d2f86a61aa96:L100-200 any range of lines.
Lines You Care About
If one order matters, say a customer complaint about order 75504, add a keep rule. Lines matching it are kept and shown on their own, even if they would have folded into a group:
abbreviatory reduce -keep 'order 75504' app.log
Errors still come first; the matches come right after them. Keep rules are regular expressions, and you can give several.
Where It Stops
It reads the levels it can find: upper-case words such as ERROR and WARN near the start of a line, level= fields, JSON level fields, glog prefixes, Python tracebacks and Go panics. A log that writes its levels some other way is still folded by repeats, but its errors may not be picked out. Two errors that differ only in a number, a port or a status code are one group. The reference has the details.